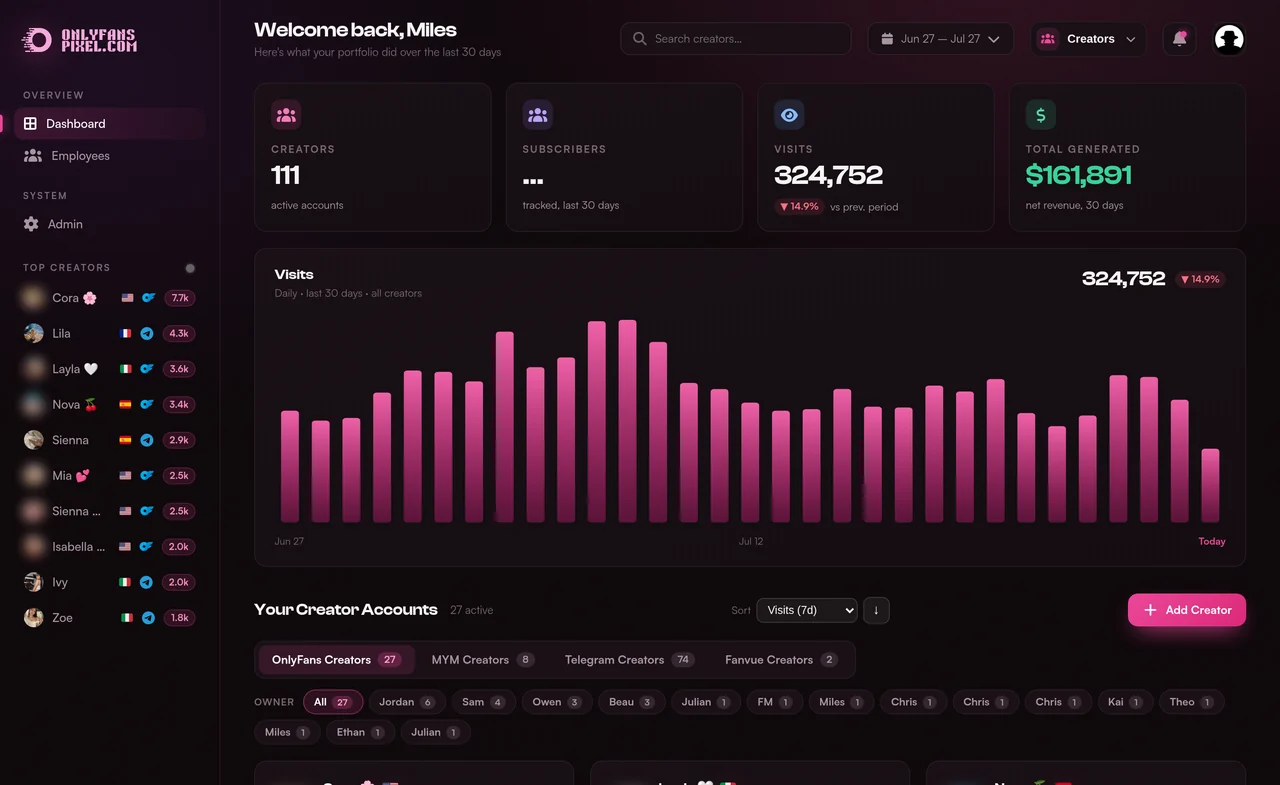
Every creator, side by side
Running a roster changes the question — from “how is my funnel” to “who do I scale and who do I fix.” Creator stats put every creator’s visits, subscriptions, spend and ROAS on one board, each scoped to its own numbers, so the answer is obvious at a glance.
A roster needs a scoreboard
One creator, one funnel — simple. Ten creators, and the real work is allocation: where does the next dollar of budget do the most good, and which creator is quietly burning it? You can’t answer that from ten separate dashboards. You need them on the same board, measured the same way.
Same metrics, honestly scoped
The comparison only means something if each creator’s numbers are truly their own.
- Traffic & visitsHow much attention each creator’s funnel is getting, over the period you pick.
- Subscriptions & spendReal server-side conversions and the fan spending behind them — the numbers that decide profit.
- Creator-scoped ROASSpend attributed per creator by resolving each ad to that creator’s landing pages, so shared ad accounts don’t muddy who earned what.
Splitting a shared account’s total evenly makes a strong creator look average and a weak one look fine. Destination-based scoping gives each creator their real number — the whole point of the comparison.
What lands on the board
Even split vs destination scoping
The same shared ad account, reported two ways — only one tells you the truth about a roster.
| What you get | Even account split | Destination scoping |
|---|---|---|
| Spend tied to the creator who earned it | ✗ | ✓ |
| Strong creators show their real ROAS | ✗ | ✓ |
| Weak creators can’t hide in the average | ✗ | ✓ |
| Budget decisions you can trust | ✗ | ✓ |
| Works across shared ad accounts | — | ✓ |
From comparison to decision
Once winners and problems are obvious, the decisions follow: pour budget into the creators whose cohorts mature well, fix or pause the ones that don’t. Creator stats turn a roster from a pile of dashboards into a single allocation decision.
Questions
Who is this for?
Agencies, managers and anyone running more than one creator. When you have a roster, the question stops being “how is my funnel doing” and becomes “which creators deserve more budget and which are leaking money” — and that needs every creator measured the same way, side by side.
How are the numbers kept separate on shared ad accounts?
Spend is scoped to each creator by resolving each ad’s destination back to that creator’s landing pages, rather than splitting an account total evenly. That stops one creator’s performance from absorbing another’s budget, which is the most common way roster reporting goes wrong.
What can I compare?
The stages that decide profit: traffic and visits, click-through, subscriptions, real spending and the resulting ROAS — per creator, over the period you choose. The point is to make winners and problems obvious at a glance.
Does it work for creators without an OnlyFans API connection?
Creators can be added and tracked at the traffic and funnel level even without a full account connection; the depth of the revenue view depends on what each creator has connected. The comparison still puts everyone on the same board.